COMBINING MSC.Nastran, SENSITIVITY METHODS, AND VIRTUAL REALITY TO FACILITATE INTERACTIVE DESIGN
Tsung-Pin YehJudy M. Vance
Iowa Center for Emerging Manufacturing Technology
Department of Mechanical Engineering
Iowa State University
Ames, Iowa
ABSTRACT
This paper will present results of a research project which investigated incorporating
finite element analysis results into a virtual environment. Three programs developed
in the course of this research are described. MSC.Nastran is used to perform
the analysis and WorldToolKit and GL are used to develop the virtual environment.
Virtual reality peripherals including a head-mounted display and a BOOM are
used with a 3D mouse as interface devices. Sensitivity methods are incorporated
into the programs to allow the designer to change design variables and immediately
view the effects without performing a re-analysis.
INTRODUCTION
Virtual reality has many definitions, but it is most fully described by Carolina
Cruz-Neira [1]:
Virtual Reality refers to immersive, interactive, multi-sensory, viewer-centered, three-dimensional computer generated environments and the combination of technologies required to build these environments.
Virtual reality techniques attempt to remove the barriers of the computer interface and allow the user to experience the "reality" of a computer-generated scene. Even though virtual reality techniques have been around since the early 1960's, it has only been in the last few years that reason-ably priced computing hardware has become available to develop virtual worlds. Prior to that time, real-time graphics tools were targeted mainly to flight simulators and cost several hundred thousand dollars [2]. With ever declining computer prices and ever increasing computer capabilities, the possibility for virtual reality to be a common design tool is approaching.
Current applications of VR include architectural walkthroughs, entertainment, health and medicine, education and training, molecular modeling, financial visualization, telepresence, and finally design [3]. The most common use of VR in design is for prototype evaluation. McDonnell Douglas [4], Boeing [5,6], Caterpillar [6], Ford [6], Chrysler [5], John Deere [7,8], NASA [9], and Northrop [5] are developing virtual prototyping environments where ergonomic assessments of preliminary designs can be made in the virtual world, thereby eliminating or reducing the need for many physical prototypes to be built. This approach holds promise for significantly reducing product development time and cost from conception to manufacturing.
The research presented here takes that scenario one step further by incorporating analysis results into the virtual world. The intent is to be able to display the stress distributions, mode shapes, etc., that result from changes in the design that are made interactively in the virtual world. In order to provide analysis results in a timely manner, sensitivity methods are used to approximate the changes in the stresses, displacements, mode shapes and frequencies due to design changes.
BACKGROUND
Design is generally a very computationally complex problem. There are multiple
design objectives, multiple design variables and multiple design constraints
to be considered. Often the design constraints are interdependent, further complicating
the problem. It is difficult for even the experienced engineer to grasp these
interdependencies from examining the results of one or two alternate design
solutions. Placing the engineer in a virtual environment with the ability to
change various design parameters that affect the design outcome will foster
experimentation with novel configurations, encourage the evaluation of multiple
design alternatives, and enhance overall design creativity. Thus, a VR-based
design tool has the potential to shorten lead times and lower overall development
costs.
The real difference in a virtual reality environment and a standard computer interface is in how the user interacts with the computer data. When using a traditional computer display, a mouse or joystick controls the viewpoint. In a virtual environment, head movement controls the viewpoint, just as in real life. In VR, if a user wants to see the back side of an object, he/she walks to the back side of the object and looks. The user has a position sensor attached to the head that signals the head orientation and position to the computer. The VR software then calculates the correct viewpoint and displays the object. The display devices can be grouped into three categories: stereo glasses, head mounted displays (helmets or HMDs), or head coupled displays (BOOM). In addition to differences in viewpoint control and display devices, there are different picking devices available for virtual environments. The key here is that the device must operate in three-dimensional space, not just the desktop. Two of these picking devices are the 3D mouse and the instrumented glove. The Visualization Laboratory at Iowa State University has equipment from all of these categories. The purpose of the research presented here is not to evaluate the suitability of each method, but to focus more on the process of taking analysis data and using it in a virtual environment.
The result of combining a VR display device with a VR picking device is that the whole paradigm of user-interaction is changed when developing virtual environments. Successful virtual reality applications depend highly on the selection and integration of these peripheral devices into the software. VR software has been developed in the last few years to make this integration fairly easy. The virtual environment software used for this project is WorldToolKit (WTK)[10]. It consists of a set of C functions that provide drivers for managing the peripherals used for interacting with the virtual world. Because of the versatility of the WTK software, environments can be developed and displayed using several different display devices. A simple change in the code allows the user to switch from one display device to another. Interaction via 3D mouse or glove is also very easy to implement using the WTK software. The programs written as a result of this project are developed on Silicon Graphics (SGI) workstations, allowing the use of both the WTK functions and the SGI Graphics Language (GL) [11] functions. These programs can be viewed using any combination of different display and interaction devices.
The problem investigated here is to develop a smooth interface to incorporate MSC.Nastran [12] data into a virtual environment and investigate the possibilities that VR offers in the analysis phase of design.
STATIC ANALYSIS
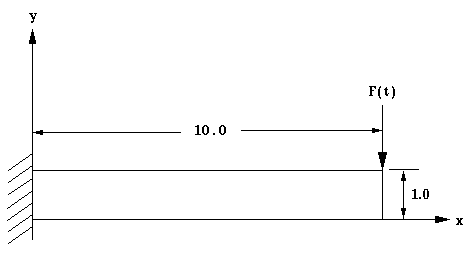
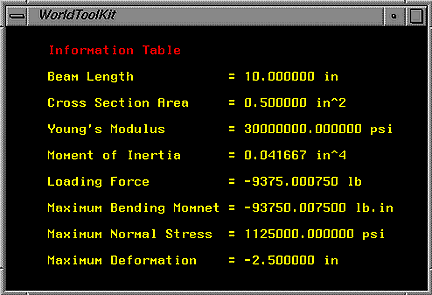
The first model consists of a cantilever beam 10 inches long, 1.0 inches tall
and 0.5 inches deep (Figure 1). A transverse force is applied to the end of
the beam which induces normal bending stresses along the length of the beam.
The finite element model of the steel beam is composed of 40 thin shell (CQUAD4)
elements. MSC.Nastran Solution 101, static analysis, is used to find the stresses
and beam deflection. The weight of the beam is neglected. A force of 750 pounds
is applied to the beam and the normal stress and deflection at each node is
output to a punch file.
Linear sensitivities of the stress and the deflection are given as:
 (1)
(1)
 (2)
(2)
These sensitivities are used in a Taylor series approximation of the form:
 (3)
(3)
 (4)
(4)
to approximate the stress and deflection that result from changes in the applied force, F. Three data files were prepared to be used by the virtual reality program: beam geometry and initial stresses were placed in a WTK data file, stress sensitivities and deflection sensitivities were each listed in a regular data file. Models of objects are developed independent of the WTK software and model data is placed in WTK data files. These files are ASCII format and written in Sense8's neutral file format (.nff). In essence, neutral file format is a listing of the geometry nodes and connectivities much like bulk data cards. In addition, the .nff file contains information about color and shading of the geometry.
A program utilizing WTK functions is developed. Based on options listed on the command line, the program will display using the monitor, BOOM, or HMD. Two picking devices are available: the 2D mouse (to be used with monitor display) and the 3D mouse. Two separate windows are opened on the viewport. The beam, the force arrow, and a color-band key indicating the magnitude of the normal stress are displayed in one window (Figure 2). Another window is used to display pertinent mathematical data (Figure 3). These windows can be viewed simultaneously or individually.
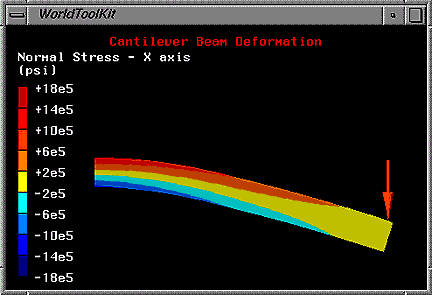
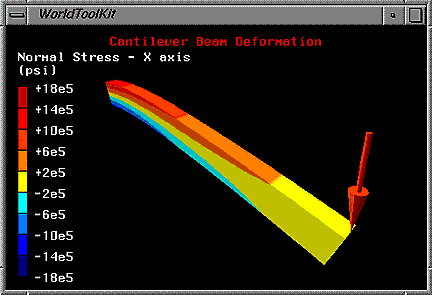
The user is able to use the picking device to grab the force arrow and move it up or down. The force arrow is fixed to the end of the beam. As the arrow is moved, the beam deflects and the color contour of the surface changes to indicate the magnitude of the normal stress. Moving the end of the beam effectively increases (decreases) the force applied to the beam. The force arrow also changes color to correspond to the magnitude of the force. New stresses and deflections are calculated using the Taylor series approximation and displayed interactively. Even while moving the force arrow, the user is able to move around the object while viewing through the BOOM or the HMD and look at the beam through an infinite number of viewpoints. The color-band key is fixed with respect to the viewer's eye position, so it always appears along the left hand side of the viewing window. Figure 4 shows the beam from a different viewpoint and the color-band in the stationary position.
In order to display the color contour of the stresses on the beam, GL functions are used to set the color at each node based on the stress data. To achieve a smooth shading, more than 1 polygon per element is needed and additional surface poly-gons for the sides and back face of the beam are needed. For this model, 10,800 polygons are used for display purposes. The color of each intermediate node in an element is determined by linearly interpolating between element nodes. Using Gouraud shading, the colors appear as smoothly shaded color bands for the element stresses.
It is important to be able to view the color-band key from any viewpoint, therefore it is desirable to fix the position of the color-band and the title with respect to the user's viewpoint. This allows the user to move around the beam and view it from any angle, yet always be able to refer to the color-bar code to determine the stress magnitude. This was accomplished by using the WTK functions to draw the color bands as an overlay onto the WTK scene. In this way, they are always displayed in the left side of the viewport and do not change position when a new viewpoint is calculated.
Although, for this simple model, stresses and deflections for any magnitude force are easy and quick to compute without using finite elements, this program demonstrated using MSC.Nastran output of one set of stresses and displacements combined with sensitivity methods to approximate the stresses and deflections along a continuous spectrum of changing forces. This was implemented in a virtual environment.
MODAL FREQUENCY RESPONSE
The same cantilever beam is used to investigate frequency response. Solution
111 is used to calculate modal frequency response using the Lanczos eigenvalue
extraction method. A dynamic load of  pounds is applied in the -y direction to the top node at the end of the beam.
The forcing frequency,
pounds is applied in the -y direction to the top node at the end of the beam.
The forcing frequency,  , is allowed
to vary from 0 to 500 Hz. Damping is set to 2% of the critical value. The results
indicate there exists one natural frequency within the range. Von Mises element
stresses and deflections are output to a punch file for all elements at 5 Hz
intervals.
, is allowed
to vary from 0 to 500 Hz. Damping is set to 2% of the critical value. The results
indicate there exists one natural frequency within the range. Von Mises element
stresses and deflections are output to a punch file for all elements at 5 Hz
intervals.
A C program incorporating both GL
and WTK functions is written to display the geometry and stresses and animate
the beam according to the input frequency. The animation was accomplished by
multiplying each nodal displacement by  .
As the beam animates, the stress contour reflects the stress state of the beam.
The user has the ability to vary the forcing frequency between 0 and 500 Hz
by moving the mouse in the virtual world.
.
As the beam animates, the stress contour reflects the stress state of the beam.
The user has the ability to vary the forcing frequency between 0 and 500 Hz
by moving the mouse in the virtual world.
The interaction with this program is similar to the static analysis example with one exception: the user now must be able to change the forcing frequency, not the magnitude of the force. This is accomplished by moving the mouse in the 3D space. When the mouse is held up, the frequency increases, when the mouse is held down, the frequency decreases. In a virtual world, more natural, 3D motions are preferred. After experimenting with this example, it was apparent that there needed to be another object in the virtual world that could be "grabbed" to change the frequency of the force.
NORMAL MODES
The second model consists of the bd03car.dat file located in the MSC.Nastran
dynamics demonstration problem directory. This is a model of a car body with
suspension springs. The model is made of CQUAD4 and CTRIA3 elements and CELAS2
spring elements. This problem uses Solution 103, normal modes, with the Lanczos
method. The displacements and von Mises stresses at each natural frequency are
written to a punch file. In addition, stress and displacement sensitivities
are calculated.
Techniques developed as a result
of the two previous models were incorporated into this program. The color-bar
remains in a fixed position with respect to the user's viewpoint and the car
body displacements are animated using .
An additional object, the control handle has been added. This handle is operated
by the mouse and is the means to control which data to display. Both the control
handle and the color-bar remain fixed with respect to the user's viewpoint (Figures
5 and 6).
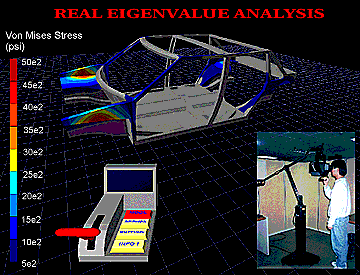
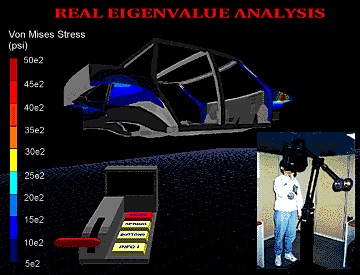
Several models of interaction exist in this program. The control handle consists of a continuously variable slider and a set of buttons. Selecting a button with the 3D mouse determines what data the user will be allowed to change. Selecting the button labeled "SPRINGS" allows the stiffness of the four suspension springs to vary as the 3D mouse moves the control handle. The stresses and mode shapes associated with each of the normal modes can be viewed by pressing the button labeled "MODES" and moving the control handle. As before, the user can move around the car body as it is animating and view it from any viewpoint.
For the purpose of reducing the computational effort required, the linear interpolation is performed only for the elements with different colors at the corresponding nodes. Some difficulties surfaced with respect to determining the surface normal for display purposes. More work is needed to determine an appropriate transformation algorithm to transfer from the MSC.Nastran bulk data cards to the WTK .nff files and maintain the correct surface normal directions.
CONCLUSIONS AND FUTURE WORK
The prior knowledge gained by experienced designers is a valuable asset recognized
by industry. Years of design experience tell designers when a design is viable
or flawed. The process of engineering design uses a combination of experienced-based,
intuitive feel for the design characteristics and a solid grasp of engineering
fundamentals. Computer visualization tools such as virtual reality can present
3D visual data to aid the designer in developing an intuitive feel for the design
response.
The inclusion of analysis data in the virtual model was successfully implemented in the course of this project. MSC.Nastran data was combined with linear sensitivities in a virtual environment to provide the engineer with a computer-based model of the design. This allows easy, quick design changes and evaluations to be performed in a 3D design space. The approximate stresses, displacements, and frequencies can be calculated very quickly once the sensitivities are known and displayed in the virtual world. Future developments related to this project will include the use of higher order approximations including Padé Approximants [13,14,15,16,17] to extend the sensitivity methods to include large design changes. In addition, the incorporation of an instrumented glove in the virtual environment will be developed.
Given the current sophistication and rapid rate of improvement in visualization hardware and software, combined with the compelling need for improved design methodologies, the development and incorporation of virtual reality techniques into mechanical design will provide designers with a powerful new capability for developing competitive products of the future.
ACKNOWLEDGMENTS
This project is being funded through a National Science Foundation Research
Initiation Award (DDM-9309663). The authors wish to thank the Iowa Center for
Emerging Manufacturing Tech-nology at Iowa State University for the use of the
equipment in the Visualization Lab.
REFERENCES
- Cruz-Neira, Carolina, "Virtual Reality Overview", ACM SIGGRAPH `93 Course Notes: Applied Virtual Reality, ACM SIGGRAPH `93 Conference, Anaheim, California, August 1-6, 1993.
- Coull,Tom, "Mission Accomplished", NASA Tech Briefs, July 1993, pp. 16-17.
- Aukstakalnis, S. and D. Blatner, The Art and Science of Virtual Reality : Silicon Mirage, Peachpit Press, Berkeley, CA,1992.
- "McDonnell Douglas leaps into virtual reality with Division," Silicon Graphics World, Vol. 4, No. 11, November, 1994, p. 11.
- Hamilton, J., E.T. Smith, G. McWilliams, E.I. Schwartz, and J.Carey, "Virtual Reality, How a Computer-generated World Could Change the Real World," Business Week, October 5, 1992, pp. 97-104.
- Adam, J.A., "Virtual Reality is for Real," IEEE Spectrum, October 1993, pp. 22-29.
- Owen, J.V., "Making Virtual Manufacturing Real," Manufacturing Engineering, Vol. 113, No. 5, November 1994, pp. 33-37.
- Puttre, M., "Virtual Prototypes Move Alongside Their Physical Counterparts," Mechanical Engineering, August, 1992, pp. 59-61.
- Hancock, D., "Prototyping the Hubble fix," IEEE Spectrum, October, 1993, pp. 34-39.
- WorldToolKit Reference Manual Version 2.0, Sense8 Corporation, Sausalito, CA, 1994.
- Graphics Library Programming Guide, Silicon Graphics Inc., Mountain View, CA, 1991.
- MSC.Nastran User's Manual Version 67, The MacNeal Schwendler Corporation, Los Angeles, CA, 1991.
- Rizai, Matt N. and Bernard, James E.,"An Efficient Method to Predict the Effect of Design Modifications," Journal of Mechanisms, Transmissions, and Automation in Design, Vol. 109, 1987, pp. 377-384.
- Vance, J.M. and Bernard, J.E., "Approximating Eigenvectors and Eigenvalues Across a Wide Range of Design," Proceedings of the MacNeal-Schwendler 1992 World Users' Conference, Dearborn, Michigan, May 1992, and Finite Elements in Analysis and Design, Vol. 14, 1993, pp. 403-414.
- Vance, J.M. and Bernard, J.E. "Interactive Analysis of Vibration Modes Using Approximation Algorithms and Computer Graphics." Computer-Aided Design, 21, No. 7, 1989, 430-434.
- Whitesell, J.E. "Rational Approximants in Structural Design Reanalysis ." Journal of Mechanisms, Transmissions, and Automation in Design , 106, 1984, 114-118.
- Vance, J.M. and Bernard, J.E., "Interactive Optimization of Finite Element-Based Problems Using Padé Approximants," under review for publication in Journal of Mechanical Design.